
Experiment 5 - Evolution of the Human Genome - Blond Hair and Blue Eyes
Introduction
Human hair and eye colour are complex phenotypes that depend on over 100 different genes. Yet a large component of the observed variability has been identified to be associated with several different SNPs that map to within or near the human OCA2 (oculocutaneous albinism type 2) and MC1R (melanocortin-1 receptor) genes, with some additional association with SNPs in the SLC45A2/MATP (membrane-associated transporter protein) and TYR (tyrosinase) genes. Polymorphism of these genes is responsible for variations seen in pigmentary phenotypes both within and between human populations, but rarer non-functional mutations also occur which are associated with dramatic changes in pigmentation such as albinism. The genotype of the MC1R gene in the Neanderthal showed that at least some of these human forerunners likely had red hair and green eyes1.
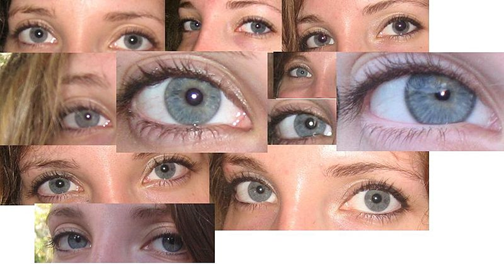
This image by Daenern1 is in the public domain, via Wikimedia Commons.
Recent genome wide studies have evaluated the accuracy of predicting human eye and hair colour in heterogenous populations of Northern European, as well as in African American, African Caribbean and Japanese populations using a limited number of SNPs within intron 1 of the OCA2 gene (rs4778138, reference 2) and within intron 86 of the HERC2 gene (rs12913832, reference 3). The rs4778138-C allele is associated with darker hair and brown eye colour. This SNP also contributes to a 3 SNP haplotype of TGT (rs7495174-T/C, rs6497268-G/T and rs4778138-T/C) which is associated with blue or green eye colour2.
The rs12913832 SNP is located 21 kbp upstream of the OCA2 gene in a region highly conserved in animals. Genotype-phenotype correlations reveal that this SNP exhibited strong associations with skin colour (P = 0.003), hair colour (P = 0.0001) and eye colour (P = 5 x 10-23) in European populations4. The rs12913832-T allele, associated with darker pigmentation and non-blue eye colour, appears to act as an enhancer of OCA2 expression, by facilitating transcription factor binding and chromatin looping between the enhancer site and the OCA2 promoter, leading to elevated OCA2 expression5. In contrast, the blue eye colour and lighter pigmentation allele, rs1291382-C, displays lower levels of transcription factor binding and less chromatin looping, resulting in lower OCA2 expression. This is readily observed in cultured melanocyte cells genotyped for this SNP4. The P-protein, encoded by the OCA2 gene, is a proton transporter required for acidification of the melanosome, the organelle within melanocyte cells responsible for pigment synthesis. A lower pH is required for optimal activity of the enzyme tyrosinase, the rate-limiting enzyme for pigment synthesis, and which is mutated in OCA1 6.
In this experiment, you will determine your genotype for the rs12913832 and rs4778138 SNPs, and correlate this with your pigmentary phenotype. This will be done using a probe-based realtime PCR assay. Like other PCR reactions you have done this week, this method uses a forward and reverse primer, but the PCR reaction also contains two related probes, that have the same nucleotide sequence except for a single base difference that corresponds to the SNP being genotyped. In addition, each probe has a covalently bonded quencher (Q) and an allele specific fluorophore (F), which when in close proximity to the fluorophore, will absorb the light energy emitted by the fluorophore and no signal (meaning no amplification) will be detected. As the PCR proceeds, the exonucleoase activity of DNA polymerase cleaves the quencher from the fluorophore, allowing fluorescence signal to be detected. Because binding of each probe occurs in a sequence-specific manner, and each allele-specific probe is bonded to a different fluorophore, the presence of each allele can be specifically detected by comparing the intensity of emitted fluorescence at specific wavelengths. This is often called TaqMan chemistry, but this is a trade-name.
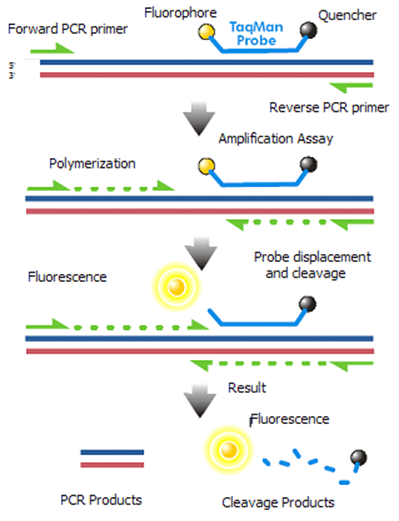
This image by Braindamaged is in the public domain, via Wikimedia Commons.
TaqMan PCR
Equipment required (per class):
- StepOne PCR Thermal cycler
- Tomy HF-120 microfuge
- Centrifuge capable of holding 96-well plates
- 96-well PCR plate with barcode (to fit StepOne PCR machine)
Equipment required (per group):
- 0.5 - 10 μL LabServ pipette and filter tips
Procedure:
- (done for you) For each SNP, prepare TaqMan genotyping master mix:
Component | x 1 | x 50 |
2 x TaqMan PCR master mix | 10 μL | 500 μL |
Nuclease-free water | 4.5 μL | 225 μL |
40 x SNP Genotyping probe | 0.5 μL | 25 μL |
Total | 15 μL | 750 μL |
- (done for you) Aliquot 15μL of TaqMan genotyping master mix into wells of 96-well plate.
- Use rows A-D for rs12913832
- Use rows E-H for rs4778138
- Dilute template DNA to 1 ng/μL with molecular grade water.
- Add 5 μL DNA to two wells for each genotyping assay.
Record which wells correspond to your DNA samples on the log sheet next to the 96-well plate, AND record them here or in your lab book: 1. rs12913832 (HERC2)
Well 1:
Well 2:
2. rs4778138 (OCA2)
Well 1:
Well 2:
- (done for you) The plate is sealed with film, centrifuged briefly, and loaded into the StepOne PCR machine (well A1 top left).
- (done for you) Start the StepOne software and run an Allelic Discrimination assay.
- (done for you) After the PCR cycles are completed, conduct an Allelic Discrimination analysis to generate an Allelic Discrimination plot for each SNP assayed.
Analysis of Results:
CXA 300 Human Molecular Biology Student Results 2015
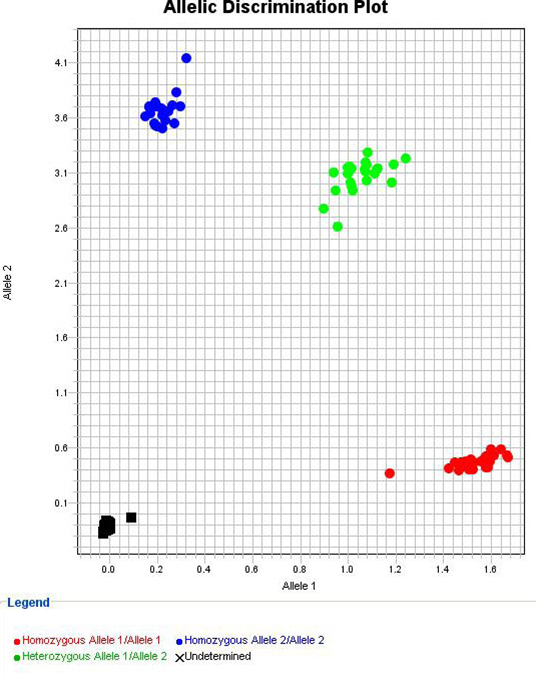
You should now have an Allelic Discrimination plot for each SNP that resembles the one shown. Note that the Non-Template Control (NTC) reactions are in the lower left-hand corner of the graph, and each allele of the SNP is represented along each axis. The first nucleotide in the brackets is the VIC dye and is shown on the x-axis, the second is the FAM dye and is shown on the y-axis. Because these fluorophores emit light at different wavelengths, it allows the different alleles to be distinguished based on the intensity of each colour of light produced in the reaction.
Samples that are homozygous for allele 1 (on the x-axis) are shown as a cluster of crosses in the bottom right of the graph, indicating that 'allele 1' fluorescence signal, but not 'allele 2' fluorescence signal has increased. Similarly, samples homozygous for allele 2 are shown in the top left. Heterozygous samples are present in the top right corner, indicating that both alleles have been amplified.
Based on the data provided to you, you should now be able to determine you own genotype for each SNP, and explain how your genotype is responsible for your phenotype.
SNP ID | Gene | Context sequence |
rs4778138 | OCA2 | GTGAAAATATAACATATCAAAATTG[A/G]CAGAACACAGCTAAATCAGTGATGG |
rs12913832 | HERC2 | GAGGCCAGTTTCATTTGAGCATTAA[A/G]TGTCAAGTTCTGCACGCTATCATCA |
Footnotes:
- Lalueza-Fox. Science 318, 1453 (2007).
- Duffy. Am J Hum Genet 80, 241 (2007).
- Sturm. Am J Hum Genet 82, 424 (2008).
- Cook. J Invest Dermatol 129, 392 (2009).
- Visser. Genome Res 22, 446 (2012).
- Sturm. Hum Mol Genet 18, R9 (2009).

Except where otherwise noted, content on this page is licensed under a Creative Commons Attribution-ShareAlike 4.0 International Licence
Note: The open version of this document may have been altered from the original. Only pages on this site that display the CC licence and logo are licensed under a Creative Commons licence.
| Attribution information | |
|---|---|
| Title: | CXA 333 - Human Molecular Biology - Open Version |
| Source: | https://www.utas.edu.au/health/resources/open-resources/resources/courses/laboratory-medicine/cxa-300-human-molecular-biology |
| Author: | Dr Stephen Tristram |