
On Boxing Day 1832 surveyors across southern Van Diemen’s Land were huddled in their tents, sheltering from the rain. Poor Charles Wedge set out to work but was ‘obliged to return’, while Raphael Clint made no pretence, recording in his log, ‘Wet day, no employment’. Their northern compatriots were spared for a day, but by 27 December they too were confined by heavy rain. A few weeks later, in the middle of January, Tasmania’s fickle weather caused further discomfort as strong winds brought summer snow to the peak of Hobart’s Mount Wellington.
This was the lot of colonial surveyors around the world. Days spent standing out in the weather shouting at assistants, measuring and recording, hunting for old boundary markers. Evenings spent huddled in a damp or stifling canvas tent doing paperwork. Surveyors had huge tracts of land to measure and faced faulty equipment, recalcitrant assistants, and surprise snakes, among other challenges.
The earliest maps of a colony were usually focussed on exploration and natural resources – surveyors followed rivers, looking for fresh water, good soils, timber, and other signals of a site for potential settlement. Later, they anchored the European takeover of the land through grants, initially scribbled onto rough maps, but eventually worked up into beautiful charts.
For the family historian, colonial maps are invaluable sources, allowing us to pin our ancestors to specific locations in place and time. Yet, as I have learned, there are some tricks to understanding and using them effectively.
Symbols
Cartographers and surveyors use abbreviations and symbols to indicate details about properties. These depend on the type of map but those on eighteenth- and nineteenth-century maps include:
- Numbers like ‘130.0.10’. This is a measurement of area: Acres. Roods. Perches. There are 40 perches to a rood, and 4 roods to an acre.
- Letter and number combinations like ‘P.43’ or ‘40/4’. These might be references to the surveyor log books, and they are worth asking the archivist or map holder about. Log books can sometimes contain details about the property or even sketches of the views.
- Terms like ‘Granted’, ‘Located’, ‘Purchased’ or their abbreviations. These indicate if a landholder was granted or purchased their property, or if their paperwork was still being processed, that is they had ‘located’ (chosen) their grant but did not yet have formal ownership of it.
Maps might also show topography, contour lines, ground cover, faint compass and survey lines, a scale bar, a north arrow, and pencilled names and property boundaries. Such details can help us pinpoint locations by making them easier to align with modern maps. They can tell us about the environment where our ancestors lived, or about their neighbours. Corrections such as crossed-out names can add to the story by showing people buying and selling their properties.
Inconsistent map sets
One frustration with colonial maps is their inconsistency, both in their very existence and the details they show. Tasmania’s Town Grant Charts, for example – a digitised collection on LISTmap – we see a patchwork of gaps, often just on the wrong side of the area of interest. Some online collections like this are works in progress, while for others the original set of paper maps is incomplete. Why will depend largely on why the map was made. Tasmania’s Town Grant Charts complement Land District Charts, so they only cover townships, while enclosure maps in Britain are patchy because they were only created when landholders sought to enclose specific parcels of land.
Colonial maps were hard-working documents and could crumble from overuse. Copies should have been made for continuing use, but these might be catalogued in a different series in the archives and so might not be digitised. You can search in the archive’s catalogue for keywords including district, parish or suburb name, surnames of people living in that area, or even surveyor’s names – and if in doubt, ask the archivist!
Older maps, such as enclosure or estate maps or early atlas entries, tend to focus on populated or prestigious areas, and the chance of finding a cartographical representation of further afield is very low indeed. The cartography that is most useful to family historians slowly gained dominance from the eighteenth century onwards, so keep your expectations low if your family tree stretches back that far.
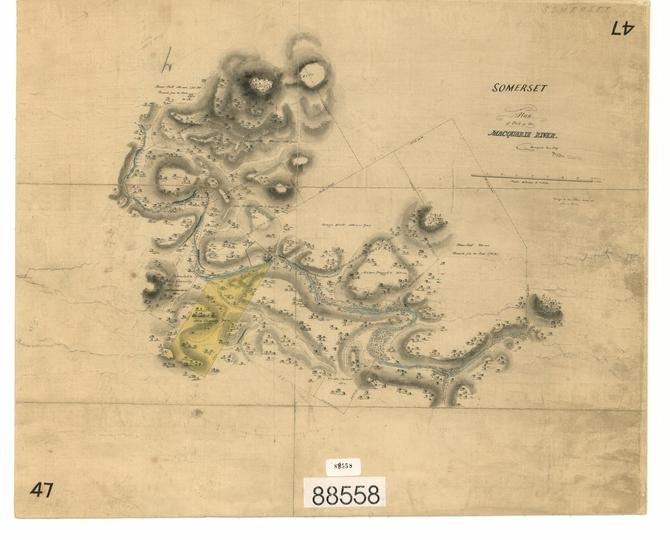
Thomas Scott, Plan of the Macquarie River (Van Diemen’s Land), 1827, Tasmanian Archives
Inaccuracies
The detail contained on colonial maps can be dubious, if not outright absurd. It was (and still is) common for maps to be copied and reprinted, often without corrections. It is not at all uncommon to find a record that says an ancestor held a property in 1825 but not find any sign of the person on an 1820s map of the relevant area.
Today, we have highly regulated land records, but that has not always been the case. Land could be swapped or sold without leaving a written trace, or occupied rather than owned by the name listed. Or perhaps the map was updated, and the old name erased. Newspapers can help by naming your ancestor as a neighbour or former occupant, but this comes down to diligent research and good luck.
Finally, returning to our opening description of the surveyor’s life, it should come as no surprise that they made mistakes. Workloads could be impossibly high and equipment poor. A colonial map was a fallible document, and the Survey Office’s priority was attaching names to the land in an act of ownership. There were plenty of acres and few fences – it was often left to landholders to define their own back lines, and court records prove just how contentious that practice became!
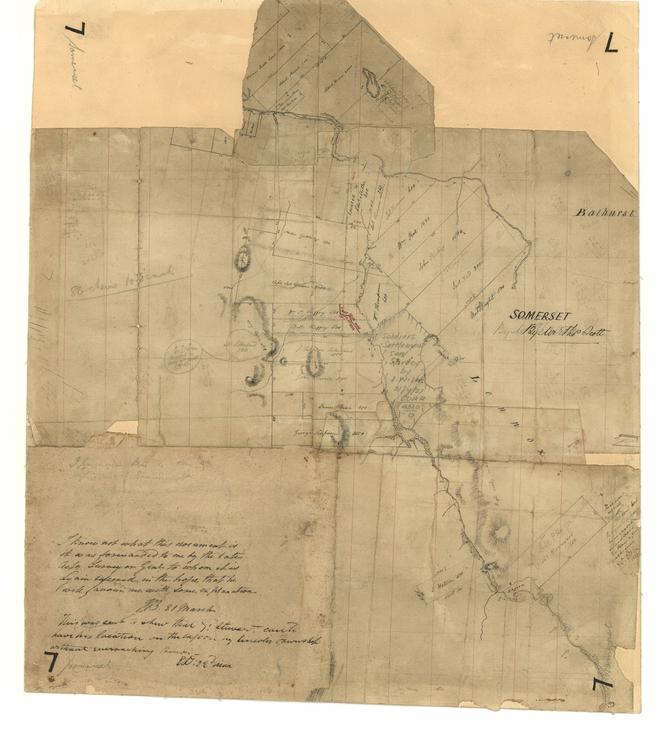
Thomas Scott, Parishes of Lennox and Bathurst (Van Diemen’s Land), 1820-1829, Tasmanian Archives
Maps should be in every family historian’s tool kit, as they help us to imagine (and visit) the lands our ancestors trod on. Like any other historical source, of course, they can be cantankerous to work with, full of gaps, and covered in indecipherable symbols. With a few tricks and some clever searching, however, it is possible to overcome those problems to get the most out of our cartographical resources.
Imogen Wegman is a lecturer in the Diploma of Family History at the University of Tasmania. She uses historic maps and the physical landscape to understand the practicalities of life in an early colony.
This article first appeared in Traces magazine.
Images
Thomas Scott, Parishes of Lennox and
Bathurst (Van Diemen’s Land), 1820-1829, Tasmanian Archives, AF396/1/951, https://stors.tas.gov.au/AI/AF396-1-951
Thomas Scott, Plan of the Macquarie River (Van Diemen’s Land), 1827, Tasmanian
Archives, AF396/1/992, https://stors.tas.gov.au/AI/AF396-1-992
Thomas Scott, ‘Tent and encampment at Holmes Hutt’, 1822, Mitchell Library, State Library of New South Wales, PXB 216, https://collection.sl.nsw.gov.au/digital/D0RMlLo2ZpWyE