UTAS Home › › Mathematics Pathways › Pathways to Business › Module Seven: Resources for Data Collection and Presentation
These resources are designed to help you with the Mathematics that you may encounter in your university units especially Quantitative Methods.
There is no pre and post test as these topics are not required before you start a university course.
Many of the links in this module are to a book published by The Australian Bureau of Statistics
It is a comprehensive statistics course with explanations, exercises and solutions. It is recommended that you download it and keep it on your laptop or tablet as a reference. It can be downloaded as a free PDF from the Australian Bureau of Statistics.
The main index for the statistics course is on page 76 in the PDF. (NOTE: that is NOT the number at the bottom of the page because some pages are not numbered.)
In the links in this module, the page reference is always the page number in the PDF not the number at the bottom of the page.
In this topic there are resources for the following:
Qualitative and Quantitative Data
Qualitative date refers to data that is in categories.
It is known as nominal data if there are several categories which have no particular order such as favourite colour or brand of car.
Or ordinal if the categories have an order such as a pain rating (none, mild, moderate, severe)
Quantitative data is numerically measured such as age or weight and the data has a natural order.
Not all numeric data is quantitative eg telephone numbers are not really numbers as you can't do any mathematical analysis of them such as finding the mean
Links
A Powerful Edge PDF Page 78
If you have not already downloaded this book, go to the Australian Bureau of Statistics website
StatTrek - Variables in Statistics
Discrete & Continuous Data
Quantitative data can be discrete or continuous.
If you roll a die, there are six outcomes and they are all discrete, meaning the values can be 1,2,3,4,5,6 but not 1.5 or 5.77 or 3.78346
If you measured the temperature every hour of the day, the value could be anywhere in a range such as 0 degrees to 40 degrees and does not need to be a whole number. This is called a continuous variable because it can take any value in a given range.
Links
A Powerful Edge PDF Page 78
If you have not already downloaded this book, go to the Australian Bureau of Statistics website.
StatTrek - Variables in Statistics
Univariate & Bivariate Data
Univariate data refers to the study of a single variable
Example
The height of each child in a school.
The speed of each car passing a speed camera.
Bivariate data refers to the study of two variables which may be related
Example
The height of each child in a school and their age.
The speed of each car passing a speed camera and the time of day.
In these cases we may be able to find a relationship between the two variables.
Links
A Powerful Edge PDF Page 78
If you have not already downloaded this book, go to the Australian Bureau of Statistics website.
StatTrek - Variables in Statistics
Maths is Fun Univariate and Bivariate Data
These resources are designed to help you with the Mathematics that you may encounter in your university units especially Quantitative Methods.
There is no pre and post test as these topics are not required before you start a university course.
Many of the links in this module are to a book published by The Australian Bureau of Statistics
It is a comprehensive statistics course with explanations, exercises and solutions. It is recommended that you download it and keep it on your laptop or tablet as a reference. It can be downloaded as a free PDF from the Australian Bureau of Statistics.
The main index for the statistics course is on page 76 in the PDF. (NOTE: that is NOT the number at the bottom of the page because some pages are not numbered.)
In the links in this module, the page reference is always the page number in the PDF not the number at the bottom of the page.
In this topic there are resources for the following:
Data can be collecting in a number of ways.
Examples
Links
Australian Bureau of Statistics - A Powerful Edge PDF Page 25 - Data Collection
StatTrek - Data Collection Methods
Data can be sampled in many ways.
Some are random meaning that a sample is chosen in such a way that it has a good chance of representing the whole population.
Some are non random such as asking for people to phone in with a vote or choose answers on a web site.
StatTrek - Sampling Methods
Australian Bureau of Statistics - A Powerful Edge PDF Page 175 - Sampling
When sample data is collected it is important not to introduce bias. For example if you conduct a survey using home land line telephone numbers during working hours your sample is likely to be biased.
StatTrek - Bias in Surveys
Australian Bureau of Statistics - A Powerful Edge PDF Page 186 - Bias
These resources are designed to help you with the Mathematics that you may encounter in your university units especially Quantitative Methods.
There is no pre and post test as these topics are not required before you start a university course.
Many of the links in this module are to a book published by The Australian Bureau of Statistics
It is a comprehensive statistics course with explanations, exercises and solutions. It is recommended that you download it and keep it on your laptop or tablet as a reference. It can be downloaded as a free PDF from the Australian Bureau of Statistics
The main index for the statistics course is on page 76 in the PDF. (NOTE: that is NOT the number at the bottom of the page because some pages are not numbered.)
In the links in this module, the page reference is always the page number in the PDF not the number at the bottom of the page.
In this topic there are resources for the following:
The total set of data collected is known as Raw Data and can be difficult to understand especially if there are a large number of data items. Raw data is often displayed in columns or tables.
Amongst the ways of summarising raw data to make it more understandable are;
Links
StatTrek - Stemplots
StatTrek - One Way Frequency Tables
StatTrek - Two Way Frequency Tables
Australian Bureau of Statistics - A Powerful Edge PDF Page 82 - Frequency Distribution Tables
Australian Bureau of Statistics - A Powerful Edge PDF Page 87 - Stem and Leaf Plots
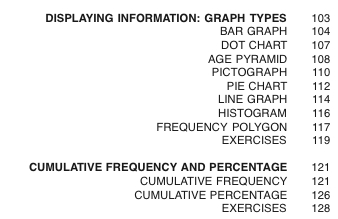
There are many ways of representing data graphically to highlight its key features. Some of the most common are;
Links
StatTrek - Bar Charts and Histograms
StatTrek - Box Plots
StatTrek - Cumulative Frequency Plots
StatTrek - Scatterplots
StatTrek - Comparing Data
Australian Bureau of Statistics - A Powerful Edge PDF Page 103 to 128 - Covers all kinds of Graphs
These resources are designed to help you with the Mathematics that you may encounter in your university units especially Quantitative Methods.
There is no pre and post test as these topics are not required before you start a university course.
Many of the links in this module are to a book published by The Australian Bureau of Statistics
It is a comprehensive statistics course with explanations, exercises and solutions. It is recommended that you download it and keep it on your laptop or tablet as a reference. It can be downloaded as a free PDF from the Australian Bureau of Statistics.
The main index for the statistics course is on page 76 in the PDF. (NOTE: that is NOT the number at the bottom of the page because some pages are not numbered.)
In the links in this module, the page reference is always the page number in the PDF not the number at the bottom of the page.
In this topic are listed some specific statistical concepts that you may come across during your studies with a brief description and some links to further resources:
Correlation
Correlation measures the strength of a relationship between two variables. See Module 7 - Topic 3. A correlation does not necessarily show a causal relationship.
Maths is Fun - Scatterplots and Correlation
StatTrak - Linear Correlation Coefficients
The tutorial includes a 17 minute video.
Spearman's Rank Correlation Coefficient
The Spearman's Rank Correlation Coefficient is used to discover the strength of a link between two sets of data. The relationship does not have to be linear.
Example looks at whether bottled water costs more as you get closer to a famous monument in Barcelona. - Barcelona Field Studies Centre
Laerd Statistics - Spearman's Rank Correlation Coefficient
Pearson Correlation Coefficient
The Pearson Correlation Coefficient is similar to Spearman but is simpler to use and can only find linear relationships.
Online Stats Book - Pearson Correlation Coefficient
StatTrek - Pearson Correlation Coefficient
Khan Academy - Pearson Correlation Coefficient
The z - score is the measure of how many standard deviations a data item is from the mean.
It is also known as the standard score.
Laerd Statistics - Standard Score
StatTrek - Z Score
Khan Academy - Normal Distribution
Sampling Distributions
A sampling distribution or finite-sample distribution is the probability distribution of a given statistic based on a random sample.
StatTrek - Sampling Distributions
Difference between Proportions
Difference between proportions is a way of comparing two independent sample proportions.
StatTrek - Difference between Proportions
Difference between Means
This is a way of comparing two independent sample means
StatTrek - Difference between Means
Central Limit Theory
The Central Limit Theory states that the sampling distribution of any statistic will be normal or nearly normal, if the sample size is large enough. (StatTrek)
StatTreK - Central Limit Theory
Student's t distribution
The t distribution (aka, Student's t-distribution) is a probability distribution that is used to estimate population parameters when the sample size is small and/or when the population variance is unknown. (StatTrek)
StatTrek - Student's t distribution
Estimation and Inference
In statistics, estimation refers to the process by which one makes inferences about a population, based on information obtained from a sample.
StatTrek - Estimation and Inference
Khan Academy - Inferential Statistics
Point and Interval Estimates
In statistics, estimation refers to the process by which one makes inferences about a population, based on information obtained from a sample. (StatTrek)
StatTrek - Point and Interval Estimates
A statistical hypothesis is an assumption about a population parameter. This assumption may or may not be true. Hypothesis testing refers to the formal procedures used by statisticians to accept or reject statistical hypotheses. (StatTrek)
One and Two Tailed Tests
A One Tailed Test is a test of a statistical hypothesis, where the region of rejection is on only one side of the sampling distribution. (StatTrek)
A Two Tailed Test is a test of a statistical hypothesis, where the region of rejection is on both sides of the sampling distribution. (StatTrek)
Links
StatTrek - Hypothesis Testing
Khan Academy - Hypothesis Testing
Khan Academy - Inferential Statistics
All Khan Academy content is available for free.
Reference Sites for Module 7
The Australian Bureau of Statistics Statistics - A Powerful Edge this is a comprehensive Statistics course with explanations, exercises and solutions. The main index for the statistics course is on page 76 in the PDF. (NOTE: that is NOT the page number at the bottom of the page because some pages are not numbered.)
You can download it and keep it on your laptop or tablet as a reference. It can be downloaded as a free PDF from the Australian Bureau of Statistics.
StatTrek - Dictionary
StatTrek - Statistics Tutorial
Khan Academy - Statistical Studies
Maths is Fun - Probability and Statistics Index
Usable Stats - Statistics Tutorials
Authorised by the Director, Centre for University Pathways and Partnership
2 May, 2018
Future Students | International Students | Postgraduate Students | Current Students
© University of Tasmania, Australia ABN 30 764 374 782 CRICOS Provider Code 00586B
Copyright | Privacy | Disclaimer | Web Accessibility | Site Feedback | Info line 13 8827 (13 UTAS)