In this topic there are resources for the following:
These resources are designed to help you with the mathematics that you may encounter in your university units especially Quantitative Methods
Introduction to Probability
The probability of a single event must be between 0 meaning impossible and 1 meaning certain.
CMIT Worksheet - Introduction to Probability
CMIT Worksheet - Probability of a Single Event
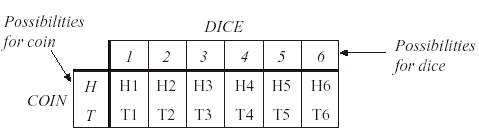
Probability Tables and Probability Trees
Can help you to understand probability problems.
This table shows all the possible outcomes from rolling one dice and tossing one coin.
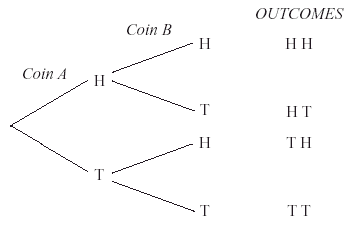
This tree shows all the outcomes from tossing two coins
CMIT Worksheet - Finding Outcomes with Two Experiments
Independent Events
Independent events are ones where the outcome of the first event has no effect on the outcome of the second event. For example if you toss a coin and then throw a dice, the outcomes do not affect each other.
Math Is Fun - Maths Resources - Probability Independent Events
Dependent Events
Dependent events are ones where the outcome of one event affects the outcome of another.
Example
Drawing 2 Kings in two picks from a full deck of cards if you don't replace the first one (From Maths is Fun)

Event A is drawing a King first, and Event B is drawing a King second.
For the first card the chance of drawing a King is 4 out of 52
(there are 4 Kings in a deck of 52 cards):
Probability of choosing a King first pick = 4/52
But after removing a King from the deck the probability of the 2nd card drawn is less likely to be a King
(only 3 of the 51 cards left are Kings):
Probability of choosing a King second pick (Given that a King was chosen first pick) = 3/51
And so:
Probability of choosing two Kings in two picks = (4/52) x (3/51) = 12/2652 = 1/221
So the chance of getting 2 Kings is 1 in 221, or about 0.5%
Conditional probability
Refers to the situations like the one above where the events are dependent.
Math Is Fun - Maths Resources with Questions - Conditional Probability
The Laws of Probability
The Addition Law for mutually exclusive events. If you toss a coin you can get heads or tails. There are no other possibilities so the probabilities of the outcomes Head and Tail must add up to 1.
If you roll a die, the possible results are 1,2,3,4,5,6 you can only get one of them and you can't get none of them so the sum of the probabilities of 1,2,3,4,5 and 6 must add up to one.
CMIT Worksheet - Addition Law
The General Addition Law also allows for events that are not mutually exclusive. For example if you pick a card from a pack of 52 what is the probability of it being a red card with a value greater than 6.
CMIT Worksheet - General Addition Law
The Multiplication Law applies to independent events, meaning the outcome of the first event has no effect on the outcome of the second event. For example if you toss a coin and then throw a dice, the outcomes do not affect each other.
If X and Y are two independent events with probabilities P(X) and P(Y) respectively, then the probability that X and Y will both happen is found by multiplying the two probabilities together:
P(X AND Y) = P(X) × P(Y)
CMIT Worksheet - The Multiplication Law
This worksheet also covers Probability Trees. This one shows the probability of throwing a six twice with two throws of a dice
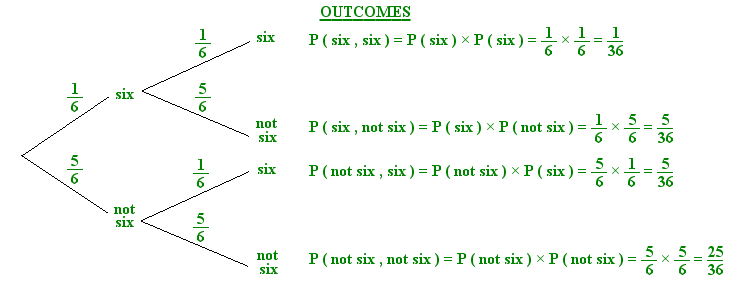
Image: www.cimt.plymouth.ac.uk/projects/mepres/book8/bk8i10/bk8_10i4.htm
Bayes' Rule (or Theorem)
Bayes' theorem is named after Rev. Thomas Bayes (1701–1761) who was the first to consider the problem. It is quite difficult to understand but is essentially about providing a method to update a prior estimate of the probability of an outcome in the light of new or additional evidence.
This YouTube video is a very clear explanation of the process.
Other resources that will help your understanding:
StatTrek - Bayes' Theorem
Better Explained - A Short Explanation of Bayes' Theorem
These resources are designed to help you with the Mathematics that you may encounter in your university units especially Quantitative Methods.
There is no pre- and post- test as these topics are not required before you start a university course.
In this topic there are resources for the following:
These resources are designed to help you with the mathematics that you may encounter in your university units especially Quantitative Methods
Expected Probabilities
The expected value of a random event is the average value if the event was repeated many times.
A simple example is the throwing of a die. The possible outcomes are 1,2,3,4,5,6 and they all have a probability of 1/6.
Over a large number of throws the average value will be 3.5 because
1+2+3+4+5+6 = 21
You can find out more at
Khan Academy Series - Expected Value
Discrete and Continuous Probability Distributions
If you roll a die, there are six outcomes and they are all discrete, meaning the values can be 1,2,3,4,5,6 but not 1.5 or 5.77 or 3.78346
If you measured the temperature every hour of the day, the value could be anywhere in a range such as 0 degrees to 40 degrees and does not need to be a whole number. This is called a continuous variable because it can take any value in a given range.
Find out more at:
StatTrek Dictionary - Probability Distributions: Discrete vs. Continuous
StatTrek Dictionary - Continuous Probability Distributions
Khan Academy Series - Random Variables and Probability Distributions
Binomial Distribution
A binomial distribution is a discrete probability distribution.
As its name suggests, it involves experiments with two possible outcomes. It is sometimes useful to think as one outcome as success and the other as failure as in tossing a coin.
The probability of each outcome must be the same on each of multiple trials. For example the chance of getting a head if you toss a coin is always 0.5, the chance of scoring a six when rolling a die is always 1/6.
The events must also be independent of each other, meaning that the outcome of one vent has no influence on subsequent events.
For more information:
StatTrek Tutorial - Binomial Probability Distribution
Khan Academy Series - Binomial Distribution
Poisson Distribution
A Poisson distribution is a discrete probability distribution named after the French mathematician.
"Poisson distributions describe the chances of a certain number of events happening in a certain interval of time or a certain amount of space, if we know the average number of times that event happens."
StatTrek - Poisson Distribution
Khan Academy - Poisson Process
Probability Density Functions
Probability Density Functions describe the probability of random values within a range
This Khan Academy Tutorial explains the concept.
For more information:
StatTrek Dictionary - Discrete and Continuous Probability Distributions
Khan Academy Series - Random Variables and Probability Distributions
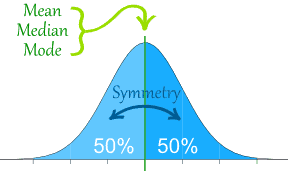
Normal Distribution
A Normal Distribution is a continuous probability distribution. It refers to situations where data is distributed around a central value with no bias left or right. The shape of a Normal distribution is referred to as a Bell Curve. It occurs in many natural situations such as the height of adults, the errors in measurements or marks on a test.
Math Is Fun - Maths Resources - Normal Distribution
StatTrek - Normal Distribution
Khan Academy Series - Normal Distribution
All Khan Academy content is available for free at www.khanacademy.org
These resources are designed to help you with the Mathematics that you may encounter in your university units especially Quantitative Methods.
There is no pre- and post- test as these topics are not required before you start a university course.
In this topic there are resources for the following:
These resources are designed to help you with the Mathematics that you may encounter in your university units especially Quantitative Methods.
Standard deviation
Standard Deviation is a measure of how spread out data is. A large standard deviation means the data is very spread out, a small standard deviation means the data is clustered around the mean.

Diagram shows 1, 2 and 3 standard deviations either side of the mean.
By Mwtoews [CC-BY-2.5 (http://creativecommons.org/licenses/by/2.5)], via Wikimedia Commons
Correlation coefficient
Correlation Coefficients measure the strength of the relationship between two variables. The value ranges from 1 to - 1
A coefficient of 1 represents a strong positive correlation.
As one variable gets bigger, the other variable tends to get bigger
A coefficient of -1 represents a strong negative correlation.
As one variable gets bigger, the other variable tends to get smaller
A coefficient of 0 represents no correlation.
A correlation does not necessarily mean there is any causal relationship between the two variables.
The examples below are from StatTrak
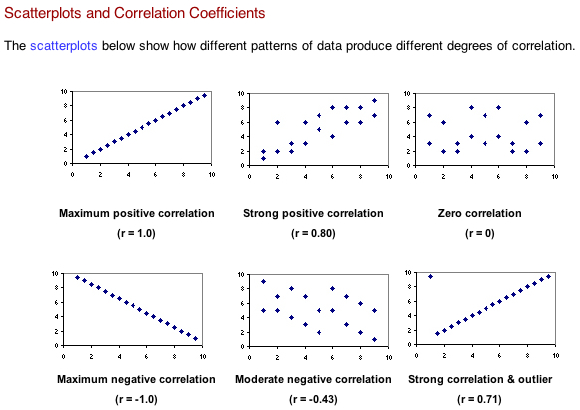
Image: http://stattrek.com/statistics/correlation.aspx
You can learn more at
The tutorial includes a 17 minute video.
Using box plots to compare groups
In Module 4 we looked at Box Plots. The material is repeated below with the addition of some new material on the use of Box Plots to compare groups. This video is from ck-12
This interactive worksheet and self test will help to check your skills and fill in any gaps.
Using box plots to compare groups
Box plots provide a good way of visually representing the same data for two different groups and quickly analysing it. Examples might be two sports teams, boys against girls, two schools or a small sample against a large one.
This short video explains the idea.
For more detail watch this longer video
All Khan Academy content is available for free at www.khanacademy.org
Reference Sites for Module 6
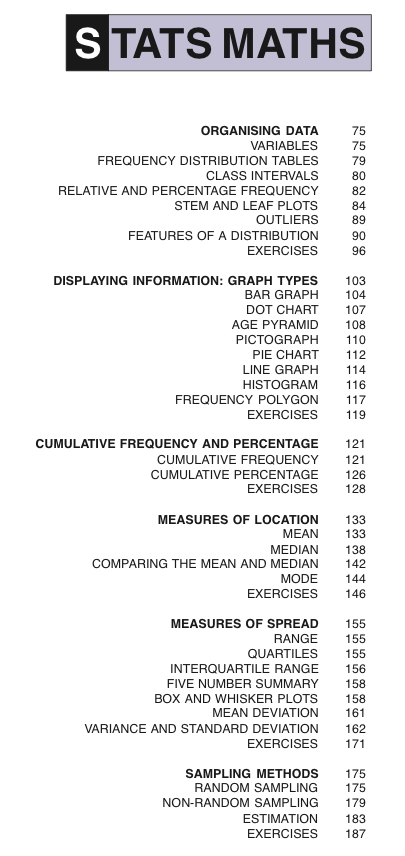
The Australian Bureau of Statistics publishes a comprehensive Statistics course with explanations, exercises and solutions. The main index for the statistics course is on page 76 in the PDF, that is NOT the number at the bottom of the page because some pages are not numbered.
You can download it and keep it on your laptop or tablet as a reference. It can be downloaded as a free PDF from http://www.abs.gov.au/AUSSTATS/abs@.nsf/DetailsPage/1331.01996?OpenDocument
StatTrek - Dictionary
StatTrek - Statistics Tutorial
Khan Academy - Complete Probability Course
Khan Academy 7th Grade Course - Statistics and Probability
Maths is Fun - Probability and Statistics Index
Probability for Dummies - Cheat Sheet - A one page summary of key points
All Khan Academy content is available for free at www.khanacademy.org