A variable is any measurable characteristic or attribute that can have different values for different subjects. Height, age, amount of income, country of birth, grades obtained at school and type of housing are examples of variables.
View the video (no audio)
Visit the Glossary of Statistical Terms to get more explanations about different types of variables and data representations.
Classifying different types of data is necessary to know if performing calculations on the data are possible and to know which graphical representation is appropriate for displaying the data.
Categorical data are often represented in bar charts and pie charts.
Examples: eye colour, shoe size, gender, month of birth.
Numerical data are counts or measures.
Examples: speed, quantities, age, distance.
Complete the activity.
At the bottom of the page there are links to download the worksheet and the solutions.
In this activity you will identify the two different types of data presented in graphs and use the graphs to answer questions about the data.
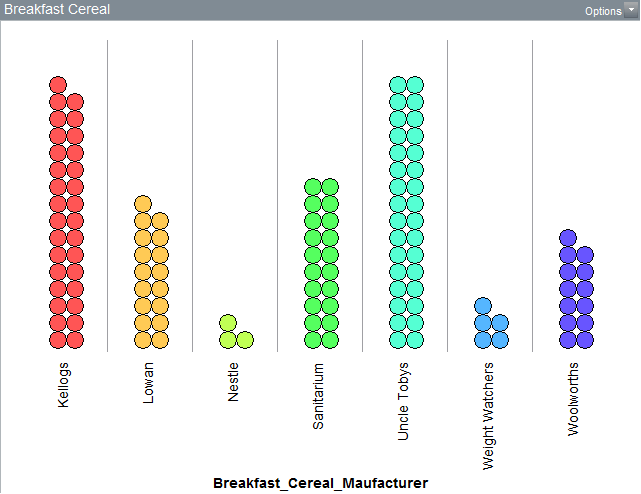
Graph 1: Cereal manufacturers
This graph shows the number of different breakfast cereal products made by seven different manufacturers. The names of the manufacturers are used as categories to organise the data.

Questions
Chick here to check your answers
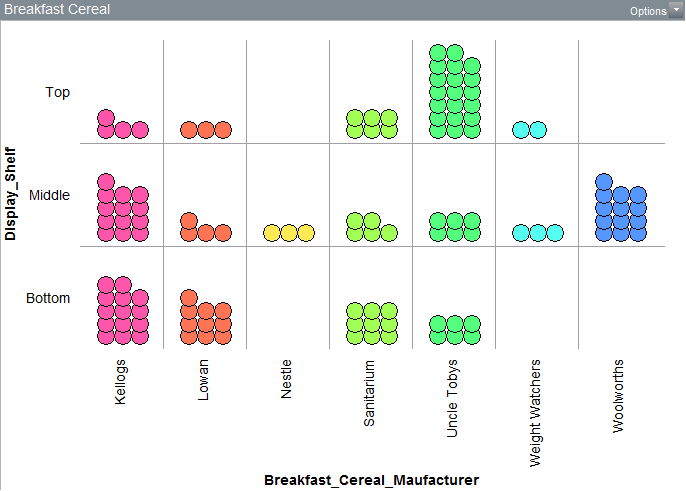
Graph 2: Number of cereal boxes on three supermarket shelves
This graph shows the placement of each manufacturer’s breakfast cereal products on three supermarket shelves.
Questions
Click here to check your answers
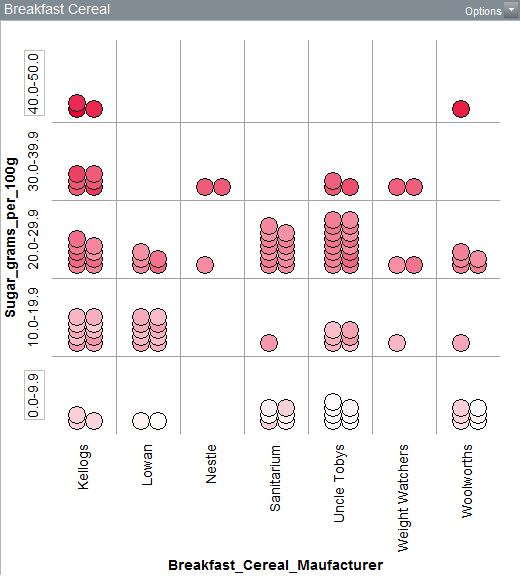
Graph 3: Sugar content in breakfast cereal products
This graph shows the sugar levels in the breakfast cereals. The data are sorted according to the manufacturer. The amount of sugar for each product is expressed as the number of grams of sugar per 100 grams of breakfast cereal and is sorted into bins.
Questions
Click here to check your answers
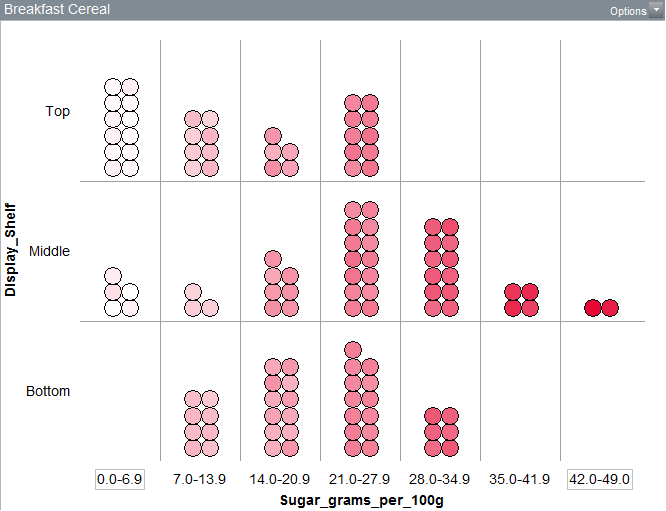
Graph 4: Arrangement of products on the shelves according to sugar content levels
Questions
Click here to check your answers
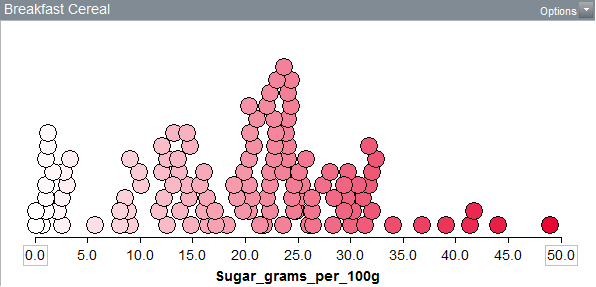
Graph 5: Sugar content in breakfast cereal
This graph shows the distribution of the sugar content in the breakfast cereal products. The distribution shows the variation in the sugar content across the range of sugar content levels for all the products. The range is the lowest to the highest value in the data set.

Questions
Click here to check your answers
Overview Questions
Graphs 1-5 display data about the same products.
Click here to check your answers
The purpose of this Big Idea was to;
Does this make sense to you now?
If so, continue on to Big Idea 3 in the Data and Statistics Module.
Often, a set of data is made up of many different cases and multiple pieces of information are collected for each case.
For example, a class of students in Grade 5 collected data about their physical characteristics and recorded the information for all the students in the one data set. The physical characteristics for each student were recorded.
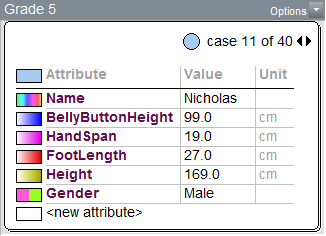
In the data set, each student in the class is an individual case and the physical characteristics of the students are attributes. These data may be recorded on data cards, which are used to sort and organise the data
In this data card, the student, Nicholas, has a height of 169.0 cm and a hand span of 19.0 cm. Nicholas' information has been recorded as Case 11 in a data set of 40 students. The attributes are Belly Button Height, Hand Span, Foot Length, Height, and Gender.
Graphs are used to represent the data in data sets. They display data in ways that assist in using the data to answer questions. Different types of graphs are needed to answer different questions and the selection of the type of graph depends on the question being asked and the data available. Data can also be organised and displayed in tables
The Grade 5 data set is a multivariate data set. It has multiple attributes for multiple cases. To answer questions about the data set, it is not always necessary to use all the data at once. Creating a graph with data for one attribute is using univariate data. Creating a graph with data from two or more attributes is using multivariate data.
Example 1: Using Univariate Data
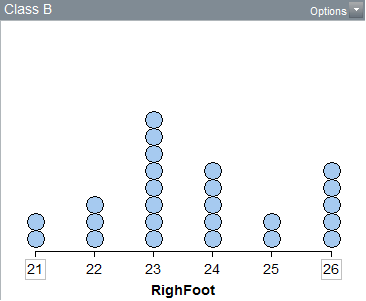
"What is the most common Foot Length of students in Class B?"
To answer the question it is only necessary to use the Foot Length data.
The graph showing the Foot Length for Class B is displaying univariate data. The graph can be used to answer directly the question, "What is the most common Foot Length of students in Class B?"
Example 2: Using Bivariate Data
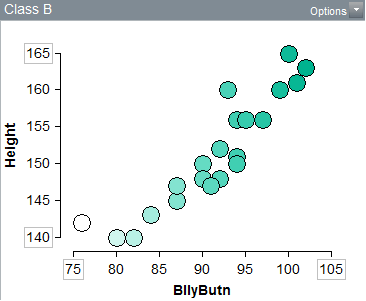
"Is there a relationship between the Belly Button Height and Height of students in Class B?"
To answer the question it is necessary to use the data from two attributes - Belly Button Height and the Height data.
The graph showing the relationship between Belly Button Height and Height for Class B is displaying multivariate data, or more specifically, bivariate data. The graph can be used to answer directly the question, "Is there a relationship between the Belly Button Height and Height of students in Class B?"
Example 3: Using Multivariate Data
Visit the Weatherzone website to view Hobart's Annual Temperatures and Rainfall data. The graph is an example of how multiple attributes can be displayed in the one graphical representation. The legend under the graph details the different elements displayed in the graph. The data are also displayed in tables. Use the graph or the tables to answer the following questions.
Questions
Click here to check your answers
Example 4: Different Graph Types
Many different types of graphs can be used to display data and answer questions about the data.
|
|
|
|
|
|
|
|
|
View the video below, ABS - CensusAtSchool - Draw a Graph, to learn how to create graphs in Excel.
Variety on the Menu

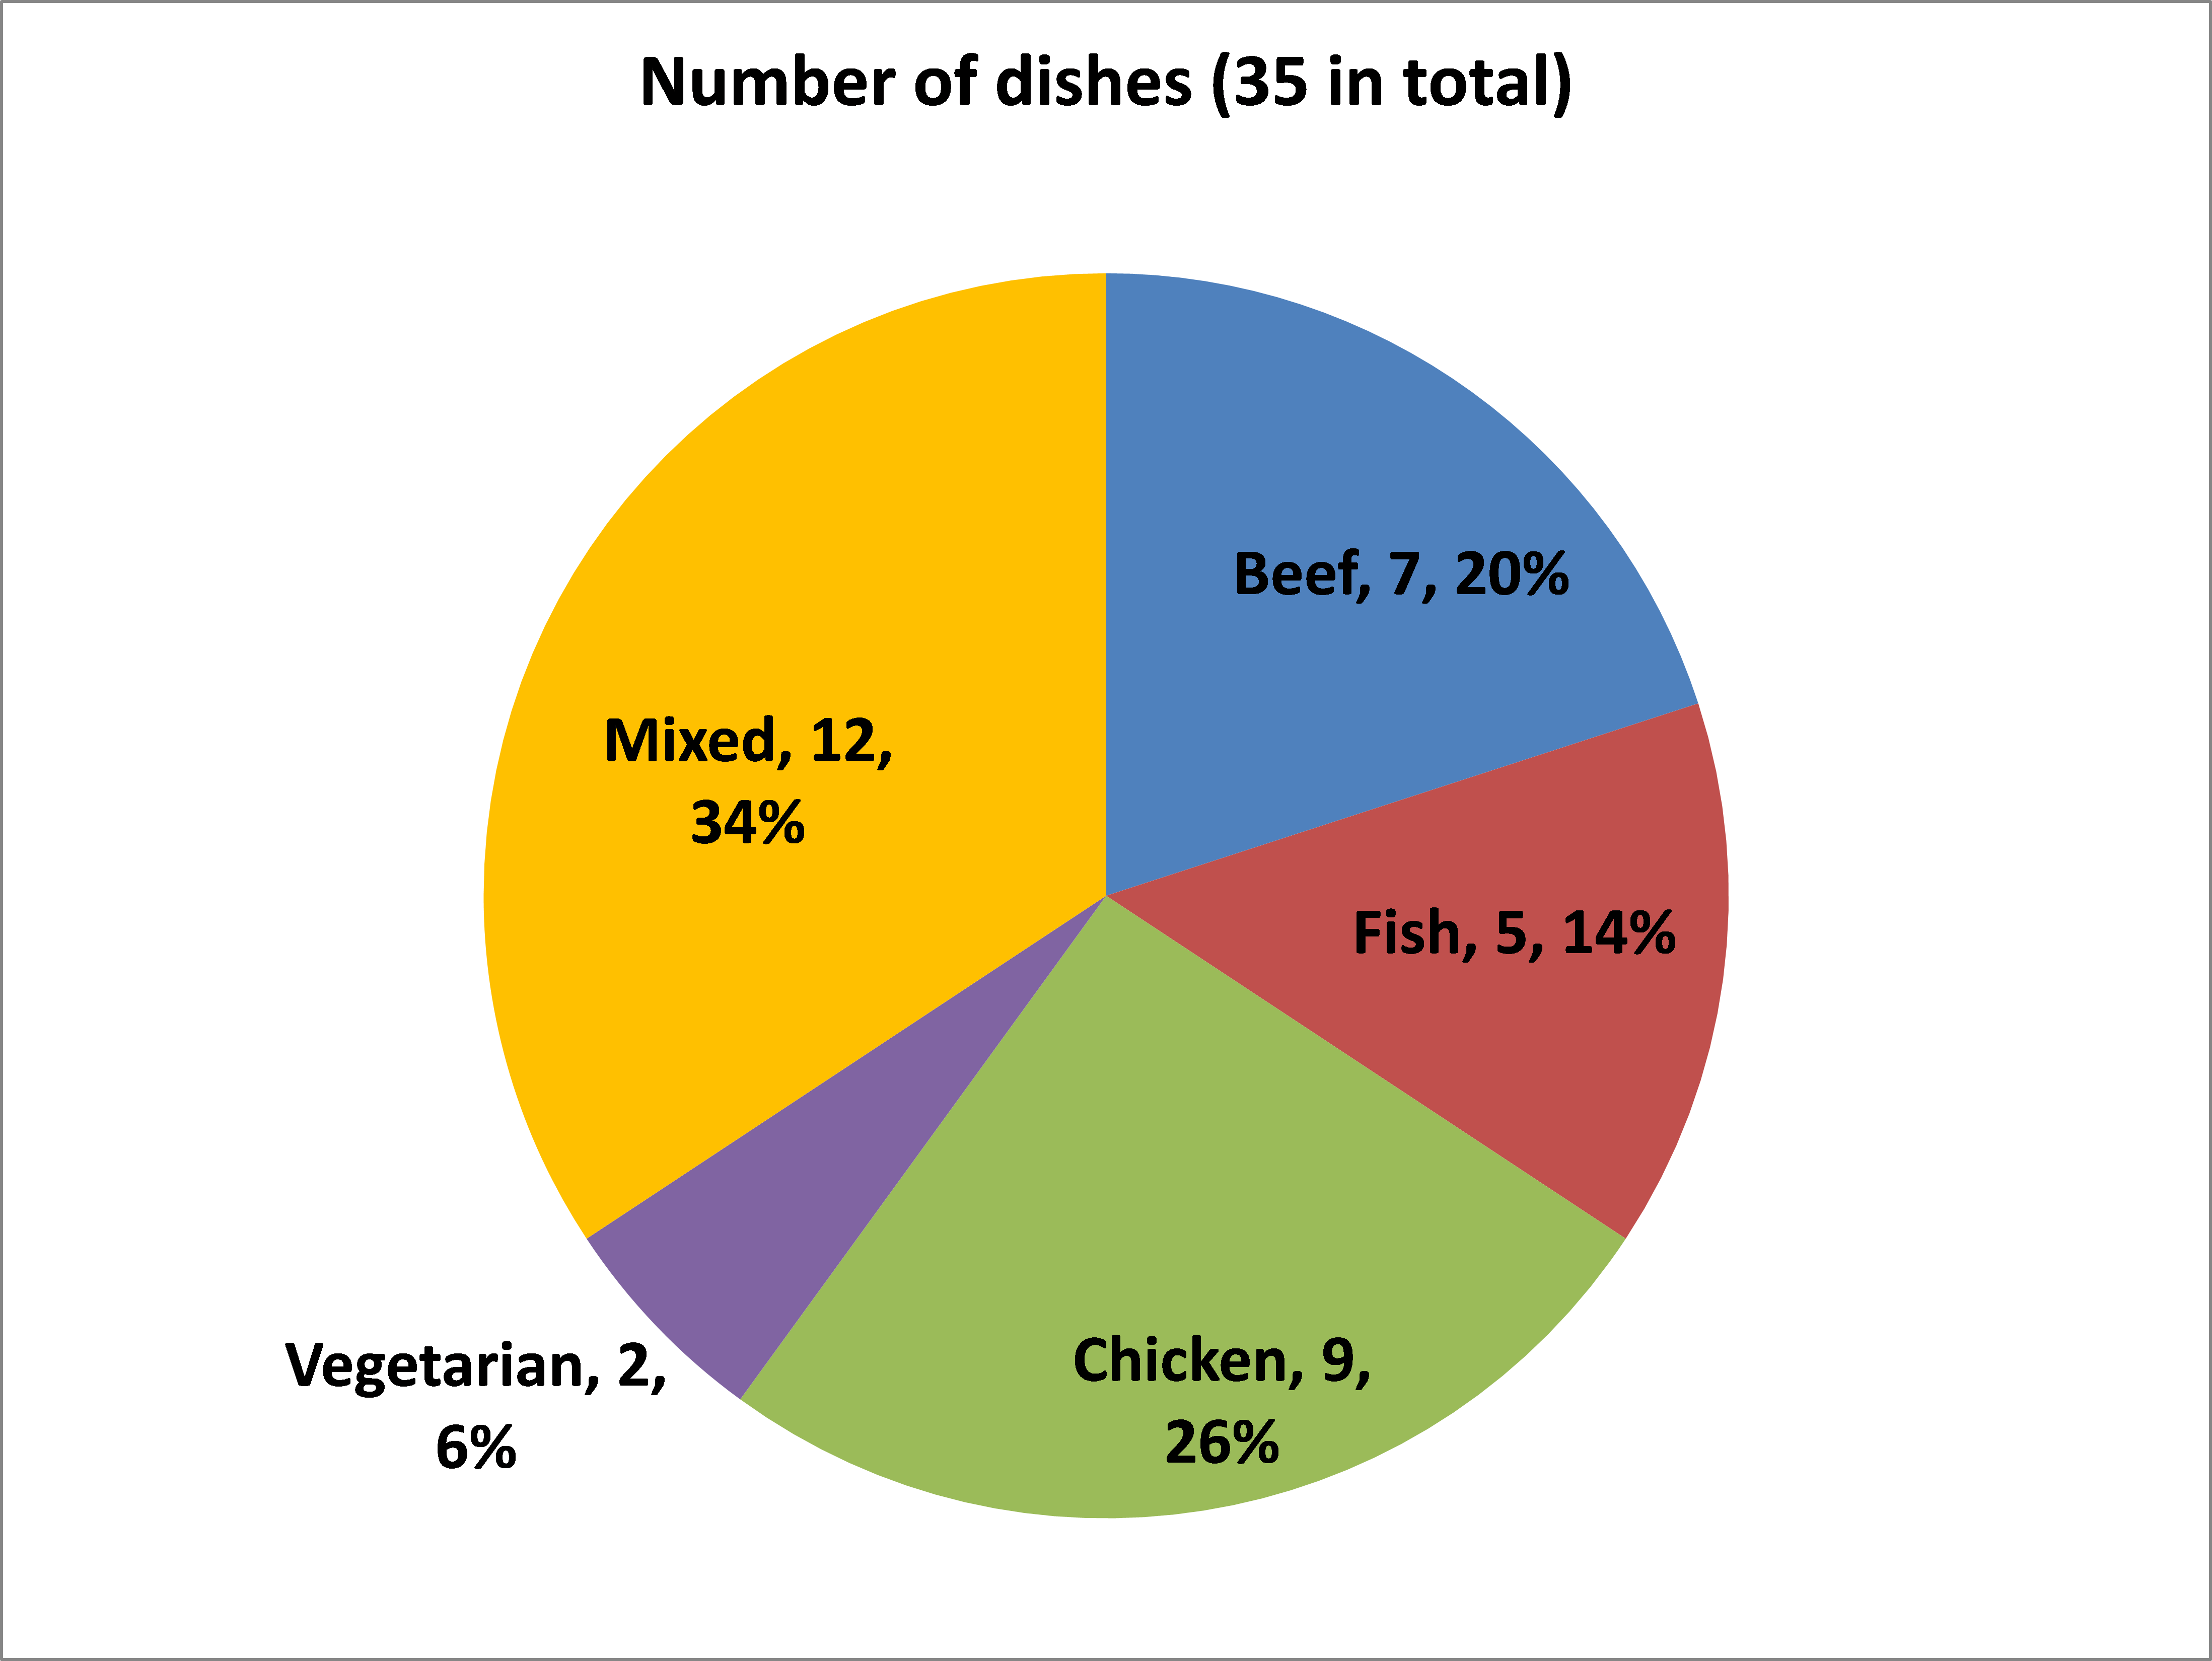
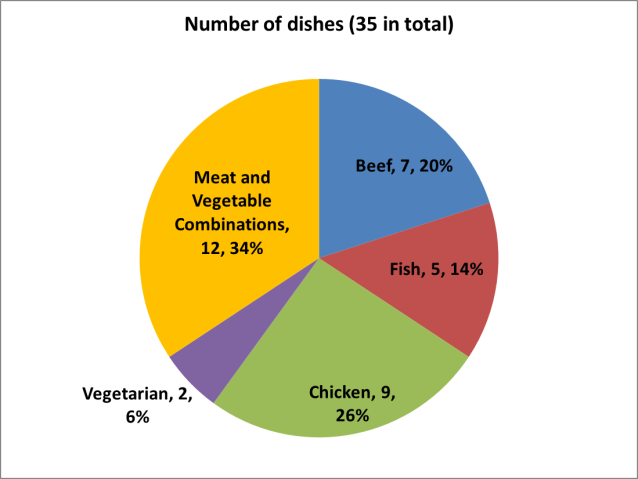
The dishes on the menu at a local restaurant are categorised according to the main ingredient in each dish. The categories are Beef, Fish and Seafood, Chicken, Vegetarian, and Meat and Vegetable Combinations.
Organising data in a table
The total number of dishes in each category on the menu is presented in the table below. The table also displays the number of dishes as a fraction of the total number of dishes on the menu, which is also converted to a decimal and into a percentage.
Complete the table
Type of Dish | Number of Dishes | Fraction | Decimal | Percentage (%) |
|---|---|---|---|---|
| Beef | 7 | 7/35 | 0.2 | 20 |
| Fish/Seafood | 5 | |||
| Chicken | 9 | |||
| Vegetarian | 2 | |||
| Mean & Vegetable Combinations | 12 | |||
| Total | 35 | 1 | 1.00 | 100 |
Questions
Displaying data in a graph
The graph below displays the categories of dishes from the menu together with the quantity and percentage data. Pie charts are good for displaying categorical data when percentages are calculated.
Graphs can be used to compare data from two or more data sets or compare two or more attributes from the same data set.
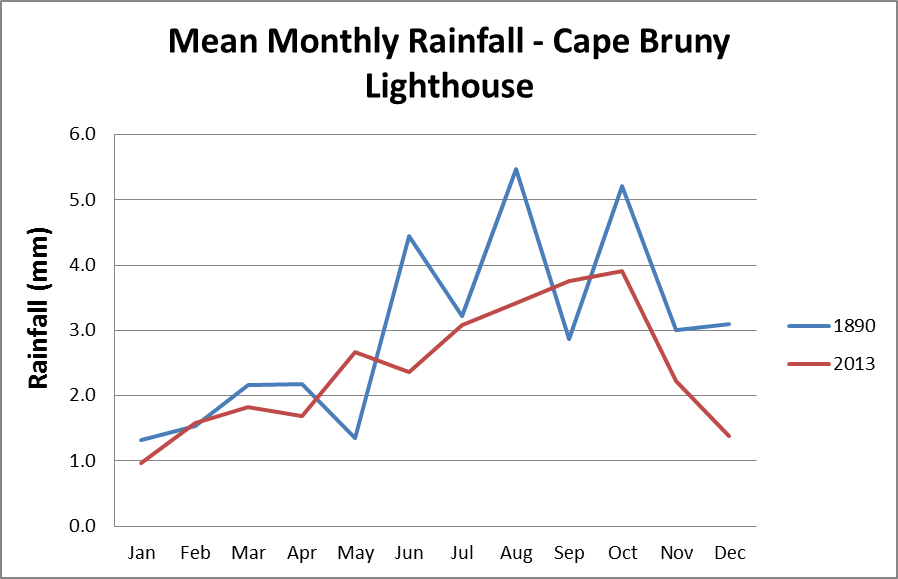
Bruny Island Rainfall
Comparing two data sets
The Bureau of Meteorology is Australia's national weather, climate and water agency.
It maintains national climatic records and water information to the Australian community. It has been recording the temperature and rainfall in Hobart for 120 years.
The graph below was constructed using some of that data. It displays the mean rainfall for each month in 1890 and 2013. Representing the rainfall data for the two years on the same graph allows direct comparison to be made.
Questions
Please note: No inferences about global warming can be made from these data. Much more evidence from multiple sources is required before such claims can be made.
Click here to check your answers
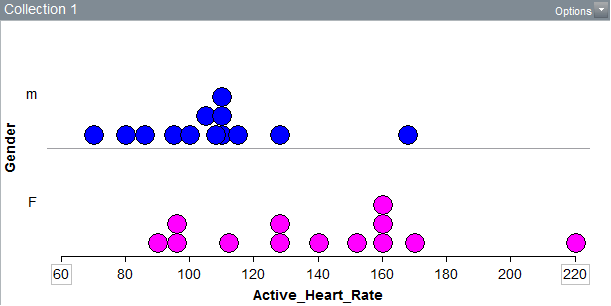
Does gender make a difference?
Students in a Grade 6 class recorded their heart rate in beats per minute before doing any exercise.
This was their Resting Heart Rate. They then recorded their heart rate after they has run around the school oval. This was their Active Heart Rate.
One of the students graphed the Active Heart Rate data to see if there was a difference between the boys and the girls in the class.
Use the graph to answer the questions below.
Questions
Click here to check your answers
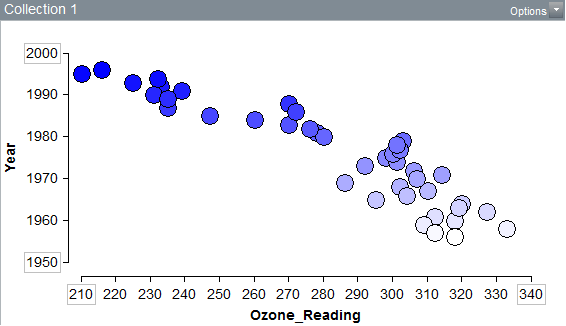
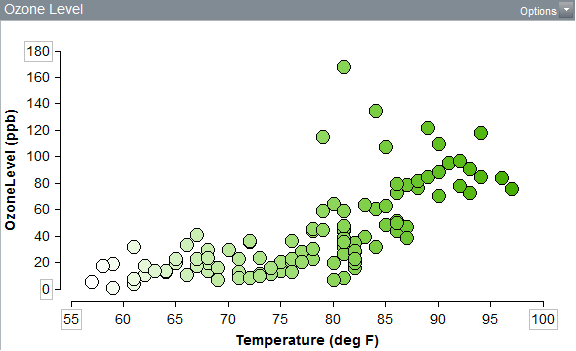
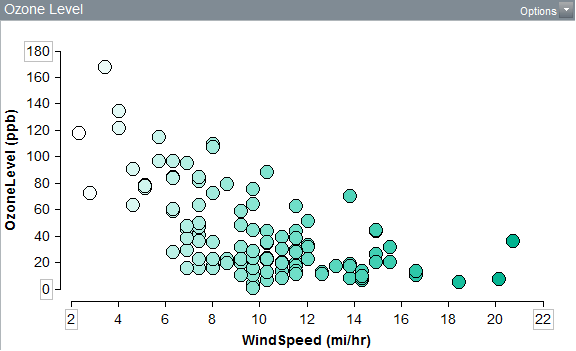
Scatter Plots
It is also possible to find relationships between different attributes in a data set using scatter plots. In scatter plots each data point is a representation of two values, which must be numerical data values.
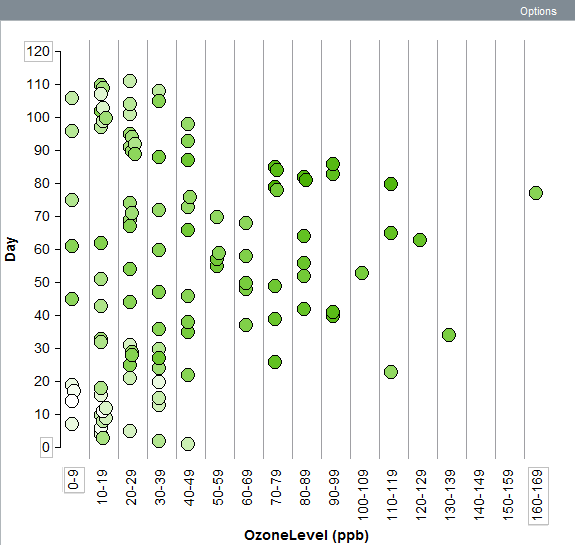
Ozone Levels
The U.S. Environmental Protection Agency (EPA) has set a standard of ground level ozone at 120 parts per billion (ppb), meaning that it considers levels higher than this to be unsafe. But research suggests that for people with asthma, long periods of exposure to a level of even 50 ppb can be harmful.
View the video that explores data collected about the ozone levels in New York in 1973.
Questions
|
|
|
This activity was developed from a data set from TinkerPlots Data Dynamic Data Exploration
Click here to check your answers
Does gender make a difference
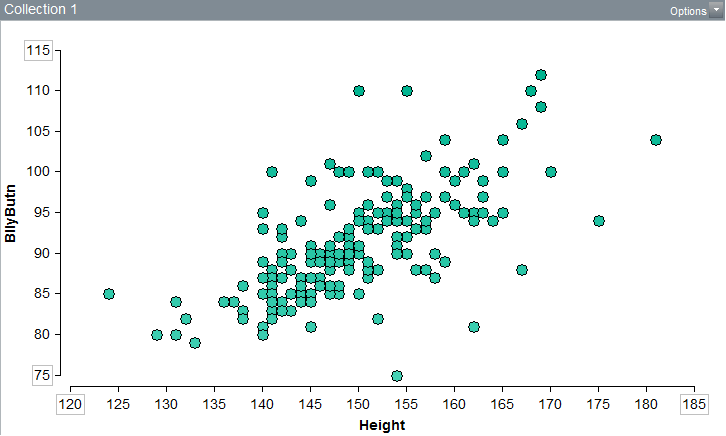
Data can be used to see if there is a relationship between children’s height and their belly button height.
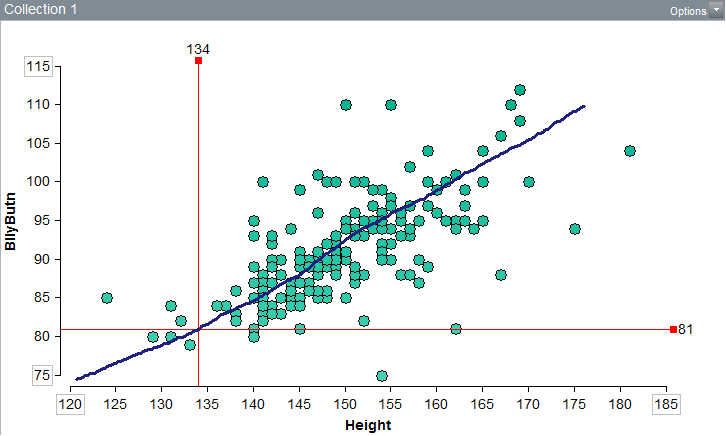
The general trend in the graph below shows that the belly button height increases as height increases. The wide spread of the data indicates that it is not a close relationship but the general upward trend of the data in the graph suggests there is a relationship, overall.
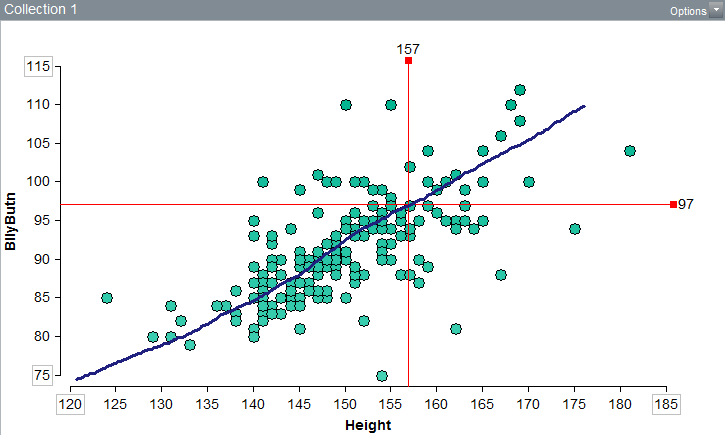
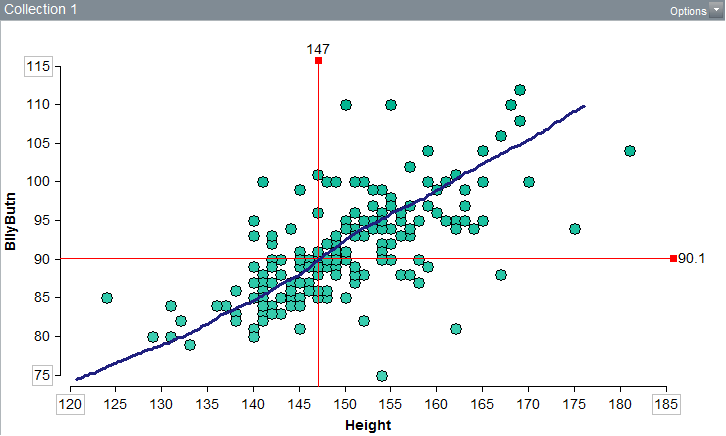
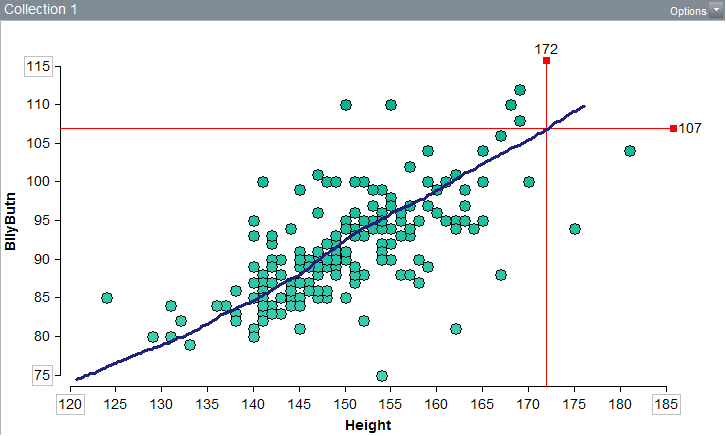
The following four graphs have a hand drawn trend line added. It shows an approximation of the relationship between Height and Belly Button Height.
Also added are reference lines that intersect with the trend line. The values of the height and belly button height that apply to the point of intersection are noted on the graph. For example, Graph (i) the point of intersection has a Height value of 157cm and a Belly Button Height of 97cm.
Dividing the height value by the belly button height value will quantify the relationship between height and belly button height as a ratio.
Questions
|
Graph |
Height (cm) |
Belly Button Height (cm) |
Height/(Belly Button Height) |
| Graph (i) | |||
| Graph (ii) | |||
| Graph (iii) | |||
| Graph (iv) | |||
| Approximate relationship between Height and Belly Button Height (Average the four calculations made) |
-- |
-- |
Graph (i)
Graph (ii)
Graph (iii)
Graph (iv)
Click here to check your answers
The characteristics of the data can be used to represent the whole data set. These characteristics are referred to as descriptive statistics. Descriptive statistics are used to describe and represent the data set as well as to compare a data set with other data sets.
Measures of central tendency
Measures of central tendency are summary statistics that measures the middle (or centre) of the data. These are known as the mean, median, and mode.
View the Statistics Intro: Mean, Median, and Mode from Khan Academy.
View the Example: Finding the Mean, Median, and Mode from Khan Academy
For more information, read Examples of Measures of Central Tendency provided by the Australian Bureau of Statistics.
Example of the mean represented in a graph
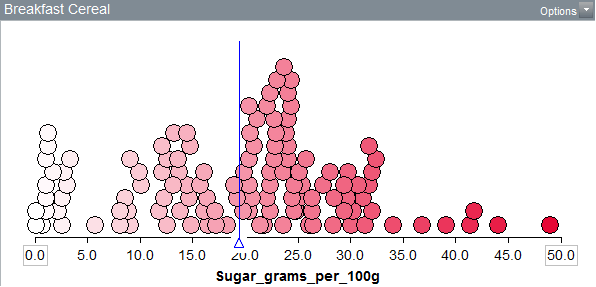
The triangle and the blue line identify the mean sugar levels in breakfast cereal products.
All Khan Academy content is available for free at www.khanacademy.org
Calculating the Mean, Median, and the Mode
Complete the following worksheet
The worksheet was generated from the http://www.math-aids.com/ website.
Using the mean to compare two groups
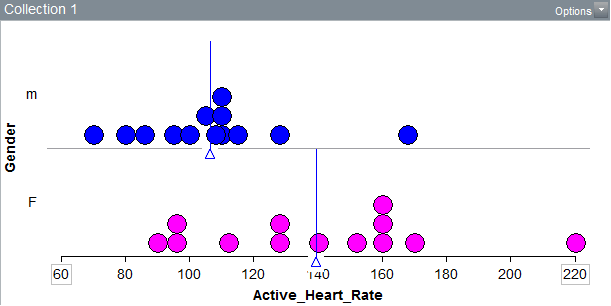
In this graph the mean active heart rates for boys and girls are denoted by the small blue triangle and the line.
There is approximately a difference of 30 beats per minute between the mean active heart rate for girls and the boys.
Because there is a large difference between the two means, it can be suggested that the boys and girls cannot be considered to be the same when it comes to active heart rate.
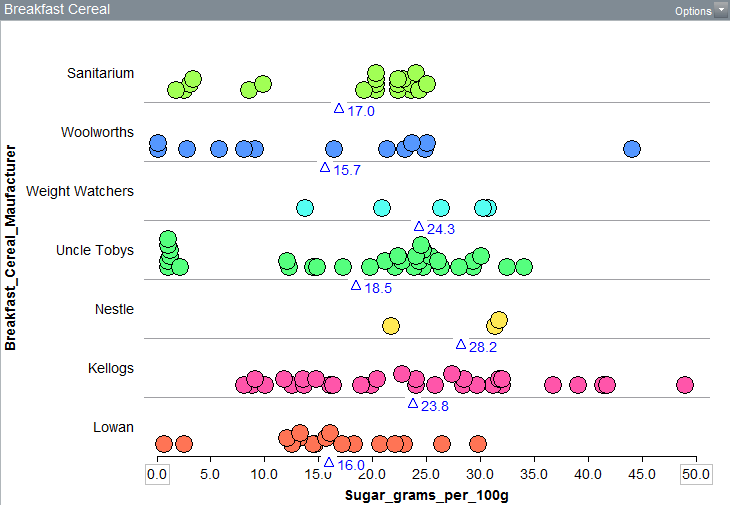
Using the mean to compare two groups
In this graph the mean sugar level in each of the manufacturers’ breakfast cereal products is denoted by the small blue triangle. The numerical values of the means are also added to the graph. The manufacturers listed in no particular order.
Questions
Click here to check your answers
The purpose of this Big Idea 3 was to demonstrate the following understandings;
Please proceed to Big Idea 4 in the Data and Statistics Module
If you enjoyed this module and Hans Rosling’s video in the introduction you may enjoy his extended TED talk below.